
Discuss this article on the forums
(Now to the meat of it – Lannie finds out her test results and explains what they mean. Are we getting to the heart of the exertional problems in ME/CFS? At least for Lannie we appear to be. Read deeply – this is important stuff. Thanks again to Lannie for sharing this. Check our her blog here.
 Now, what I’d been waiting for… the results! Well, the preliminary ones at least. Below provides a scan of the chart received at the end of a two-day cardiopulmonary exercise stress test at the University of the Pacific Fatigue Lab. Please ignore the chicken scratch. That was from me taking notes as frantically as my foggy mind could that day.
I’d like to preface this review by stating how I felt during the test, before I tell you the actual results. I just think it’s very interesting… perception versus reality.
For a little bit of background, I’ve always been outgoing and active. One of my biggest hurdles in managing my CFS and Lyme is retraining myself to not be as physical and over-the-top expressive and continue my old ways because it burns up my energy. I always seem to think I’m “not that bad.” And the midwesterner in me has the habit, even when asked by a doctor “so, how are you?,” to respond in a knee jerk reaction with “Great! How are you?” In the end, not so helpful.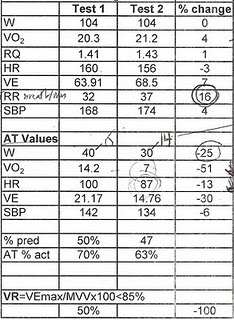
So after day one, I’m in the car with my mom, and I tell her I think I failed the test. Meaning, I didn’t think it was THAT hard and I’m sure I could go back the next day and do it again. So in failing, I meant I think I passed it and that there’s no way they’d be able to find disability. I mean, I was on that bike, and I was loving every minute of it. Sure it was hard, but working out is hard. And I miss working out.
At the end of day two, sure it had been a tough a day. But I was still standing, figuratively only of course… Note once I got off the bike I spent the next 15-20 minutes on the exam table in the fetal position. But in my mind, I rocked it. Little did I know the fall out that would occur the days following. It has taken me over two weeks so far, and I’m still not back to normal. No matter, I just thought I’d share that little anecdote as another reminder of how tricky CFS can be. Especially since it seems to target go-getters and overachievers. People who always think “sure I can do that” and “oh I’ll be fine” and have trained ourselves our whole lives to bounce back.
Well, the results did not show that I was “just fine.” I’ll post them again in smaller bites so it’s easier to reference. First I’ll start with my peak values.
PEAK VALUES
W=Watts is the peak amount of watts exerted each day. Both days I reached 104. This showed the team, and anyone (read: disability reviewers) questioning if I provided a solid amount of effort, that I provided sufficient effort for proper test results. Also, it shows the effort was matched both days for proper benchmarking. The team seemed very happy with 104.
VO2=Maximal Oxyg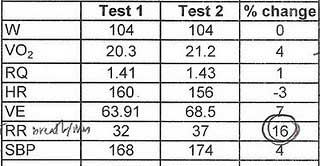 en Consumption (or peak aerobic capacity) is the maximum capacity of an individual’s body to transport and use oxygen during exercise. It reflects the physical fitness of an individual. So this is where CFS reared its ugly head. On day one, my peak VO2 was 75% of the predicted value of a sedentary woman my age. Day two was similar.
RQ=Response Quotient is the measurement of oxygen to carbon dioxide. In both days I had a peak RQ of over 1.4. This measurement is another guide that proves exertion. They say the golden number for this is 1.1. Having a 1.4 proves to any one questioning my “giving it my all” on the test. Another tidbit this score told the team is that I have an extremely high pain threshold and capacity to handle lactic acid. I’m not sure how, but that’s what Staci told me. I have always thought I was pretty tough. But now there’s proof! This could explain why I’m not as crippled by pain as some CFS and Lyme patients. I have my days, but luckily I don’t feel it as crushingly as others do. Thank God!
HR= Heart Rate, or in this instance my peak heart rate, was 160 on day one. That is 82% of the predicted value of a sedentary woman my age when exerting 104 watts. It decreased to 156 on day two, or 80% of the predicted value of a sedentary woman my age. And just to make this perfectly clear, if a healthy yet sedentary woman of 33 years old performed this test, not only would their peak reach 195 but they’d reach it both days consistently.
VE= not discussed
RR= Response Rate or breaths per minute. My peak for day one was 32, and day two was 37. What this means is that it took me 5 more breaths per minute to produce the same amount of work (the 104 watts) on day two. I had a decrease of 16% in my response rate post-exertion. Again, a healthy person would have the same RR each day. Again, this proves I suffer from post-exertion malaise caused by CFS.
SBP= not discussed
AT VALUES
Note in contrast to the previous set of peak figures, these are the results achieved at Anaerobic Threshold (AT). Remember, as we go past our AT, this is when workouts become less effective for athletes and activity for people with CFS becomes crash-inducing (due in part to oxygen deprivation and lactic acid production).
W=Watts achieved at AT on day one was 40. Alternatively put, I was able to produce 40 watts prior to reaching my AT. Day two, post-exertion, I reached my AT after only achieving 30 watts. Remembe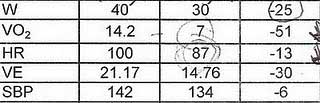 ring both day one and two I was able to produce 104 watts total, this means if I was an athlete all the work I did from 41-104 (the majority of my activity) would be considered unproductive. As a CFS patient this means the majority of my time on the bike I was inducing oxygen deprivation and creating large amounts of lactic acid. On day two, post-exertion, my productivity prior to reaching AT was also 25% less than my day one. To make this crystal clear, a healthy person doing the same test and producing the same amount of watts two days in a row(as I did with 104 watts) would achieve the same amount of watts prior to reaching a much higher AT level consecutively on both days. I was only able to produce 75% of the previous day, on day two.
VO2 = Maximal Oxygen Consumption on day one at AT was 14.2. It just makes the cut off for “healthy” by the American Heart Association’s categories of people with heart disease. Day two, my VO2 dropped more than half to 7. The 7 puts me well into the lowest category of severely disabled for those with heart disease. I don’t have heart disease; even so you do not ideally want the same biomarkers as someone who’s in the bottom bracket of the heart disease hierarchy. Especially considering VO2 is the maximum capacity of an individual’s body to transport and use oxygen.
HR= Heart Rate at AT on day one was 100. On day two, post-exertion, my AT was only 87. Again, a healthy person exerting the same amount of watts as I did over two days would produce the same AT each day, not drop 13% day two.
VE= not discussed
SBP= not discussed
Perceived Rate of Exertion
Another piece of data I learned, not noted in the above charts, was regarding the Perceived Rate of Exertion (PRE) I discussed in Part 2. If you remember, I had to report my PRE to the team at approximately every 5 watts during the test.
Staci s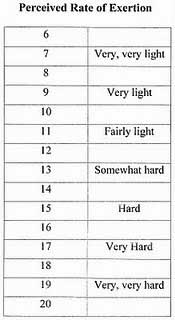 howed me in black and white my perceived rates of exertion(PRE’s) directly compared to my actual heart rate. You will note the PRE chart starts at 6 and ends at 20. Add a zero to the end of each of those numbers, and you will see they’re actually talking heart rates 60-200. Makes sense. Average resting heart rate is 60, and average exerted heart rate is 200.
In a healthy person, time and time again, when they guess their PRE during a stress test using this 6-20 scale it’s almost exactly their heart rate once a zero is added. However with CFS patients, the PRE is almost always at least 20 to 60 points higher than the actual heart rate. For example when I reached my AT on day one, my heart rate was 100, but I reported a PRE of 15 (or 150), and again on day two when my heart rate was 87 I reported a PRE of 14 (or 140). The reason is simple; smaller activities feel so much more difficult to a CFS patient due to all the added side effects we’re feeling – oxygen deprivation, additional lactic acid production, heart palpitations, poor circulation, blood pooling in the feet, etc.
So at this point, you might question what to do with all of this information. First and foremost, it proves Post-Exertional Malaise. I’m extremely excited to see, and then provide, the full report to my disability attorney as well as my LTD provider. But more importantly, I’m implementing what I’ve learned into my daily life. I’ll walk you through how I’m doing just that, and why, in Part 4.